M Baas
I am a machine learning researcher at Camb.AI. I post about deep learning, electronics, and other things I find interesting.
Making a decent and modern home air quality sensor
by Matthew Baas
Making a functional air quality sensor with a raspberry pi and a few sensors, with a companion app.
TL;DR: I will showcase the process of designing and implementing a home air quality sensor using a Raspberry Pi Zero W. Several sensors are used together to measure CO2, eCO2, tVOC, temperature, pressure, humidity, and particulate matter (PM10, PM2.5, PM1) levels in real time and relay this data to a cloud Oxide service. With some javascript and typescript, the Oxide service also acts as an app distribution platform and allows us to view the latest data from a desktop, android, or iOS device. The hardware uses a total of the ~0.8W and is fairly cheap once-off (under R2000 ZAR for all components and cables in 2020), while the cloud/app side has variable costs depending on what you do.
This post assumes basic programming knowledge of python coding, device peripheral communications, and some limited javascript/typescript. The aim of this post is to provide a description of the air quality system and its construction in the hopes that you, dear reader, might find it useful if you are aiming to build your own air quality system, or just for amusement :).
Background
I looked around online and in person for a reasonably functional home air quality sensor. Unfortunately, all the products or solutions I found had at least one of the following big problems:
- Had a recurring subscription cost to a 3rd party service that might go out of business (I really despise hardware which stops working if you end a software subscription)
- Had only 1 sensor: they only measure tVOC, or only measure temperature, pressure, and humidity – not very useful on its own.
- Had no app functionality (i.e. they display their results on a local screen): I want to be able to view my latest sensor readings on all my devices, so I need this.
- Had cloud and app functionality for free, but sent all your data through a data center in a very not-privacy-friendly country.
- Looked incredibly dodgy and lacked reasonable datasheets or specifications for the sensors it provided.
So, still wanting to obtain an air quality sensor that I could actually use and not sacrifice on the above, I had to design my own system and software stack. In the following sections I detail the steps taken to design and implement the system, as well as the final result. Let us get started.
1. Plan
We want an air quality system that:
- Can measure several important air quality measurements
- Can update these measurement readings at least every few minutes
- Can be viewed on any device connected to the network (local or entire internet)
- Does not store logs or data beyond a set history length (for privacy).
- Is reasonably affordable (at the time of writing, this corresponds to roughly < R2000 ZAR / $150 USD once off, and < R150 ZAR / $10 USD per month for cloud services)
With these considerations in mind, the setup I came up with is given in the system diagram below:

This setup covers a swath of the basic air quality measurements and does not require any additional header boards or extenders. If, for example, I only used sensors that communicate via UART, I would not have enough UART pins directly on the Pi Zero and would need to make some extender or multiplex arrangement.
1.1 Parts list
The specific sensors chosen for each block above was a function of (a) what is readily available to ship to my location, (b) documentation and datasheet availability, and (c) cost. With these criteria in mind, the full parts list is as follows:
- Raspberry Pi Zero W : this serves as the central microcontroller for all the sensors, and relays the latest data to the server via wifi.
- Wave BME280 sensor : this serves as our temperature, pressure, and humidity sensor. The specific BME280 chip is available in a variety of products, so I’m sure one variant will be available in your region.
- SparkFun CCS811 sensor : this serves as our total volatile organic compound (tVOC) and equivalent carbon dioxide (eCO2) sensor. Other CCS811 variants are readily available in different regions.
- MH-Z19 NDIR CO2 sensor : this device measures the level of CO2 in the air.
- PMS 5003 sensor : this sensor provides various measurements of the total particulate matter content in the air for various particle sizes.
- Any 5V, 3A USB power supply, together with power cables for the Raspberry Pi Zero W. For example, this product is fairly cheap and works sufficiently for our purposes.
- At least 20 Male-to-Male, Male-to-Female, and Female-to-Female jumper/ribbon cables. Here’s an example product similar to the one I used.
1.2 Software stack
The software stack is split into 2 parts. The first part is the software on the raspberry pi. It is chosen based on (a) what is simplest and quickest to implement, (b) what pre-existing libraries exist of each sensor, and (c) what programming languages I am proficient in.
In light of this, the software stack is dead simple: a python script which runs when the raspberry pi boots. Each of the sensors has a python package available online which makes connection to devices very simple. Then with some networking code we connect to the server regularly to send new sensor readings.
For the server side, similar considerations apply, in addition to the consideration of (d) I don’t want to install node on my local machine – look, if node ever doesn’t require 10 years to install and take up several GB of space on my machine, and generally just appeared to be doing less dodgy things on my machine, then I will be much less stringent on this point – and (e) I don’t want to have to interact with google or apple to get an app working on the app store. With these in mind, I chose typescript and javascript on Oxide as my server-side setup.
The Python code on the raspberry pi will interact with a node backend server on Oxide, which will also act as the database and distribution center for all the desktop and mobile applications. It is currently $10/month for everything included (database, iOS/desktop/android apps, node server).
Disclaimer: a family member of mine works for Journeyapps (who make and own Oxide), and I learnt about the Oxide platform from them. So this is a conflict of interest in my determination of software stack. Feel free to choose your software stack for any part of this project for what works best in your situation. I found Oxide to work the easiest out of the other solutions I’ve come into contact with for getting a single javascript app deployed on desktop, iOS, and android with minimal effort and zero interaction with apple or google directly.
2. Physical construction
Since this post is in part meant to help anyone trying to make such a system themselves (as opposed to purely documenting the system I built), I will not give exact pin connections since there is a good chance that the specific sensor or raspberry pi models you have will have different pinouts than the ones I have used here.
First, most Raspberry Pi models have the same GPIO pin layout, namely:
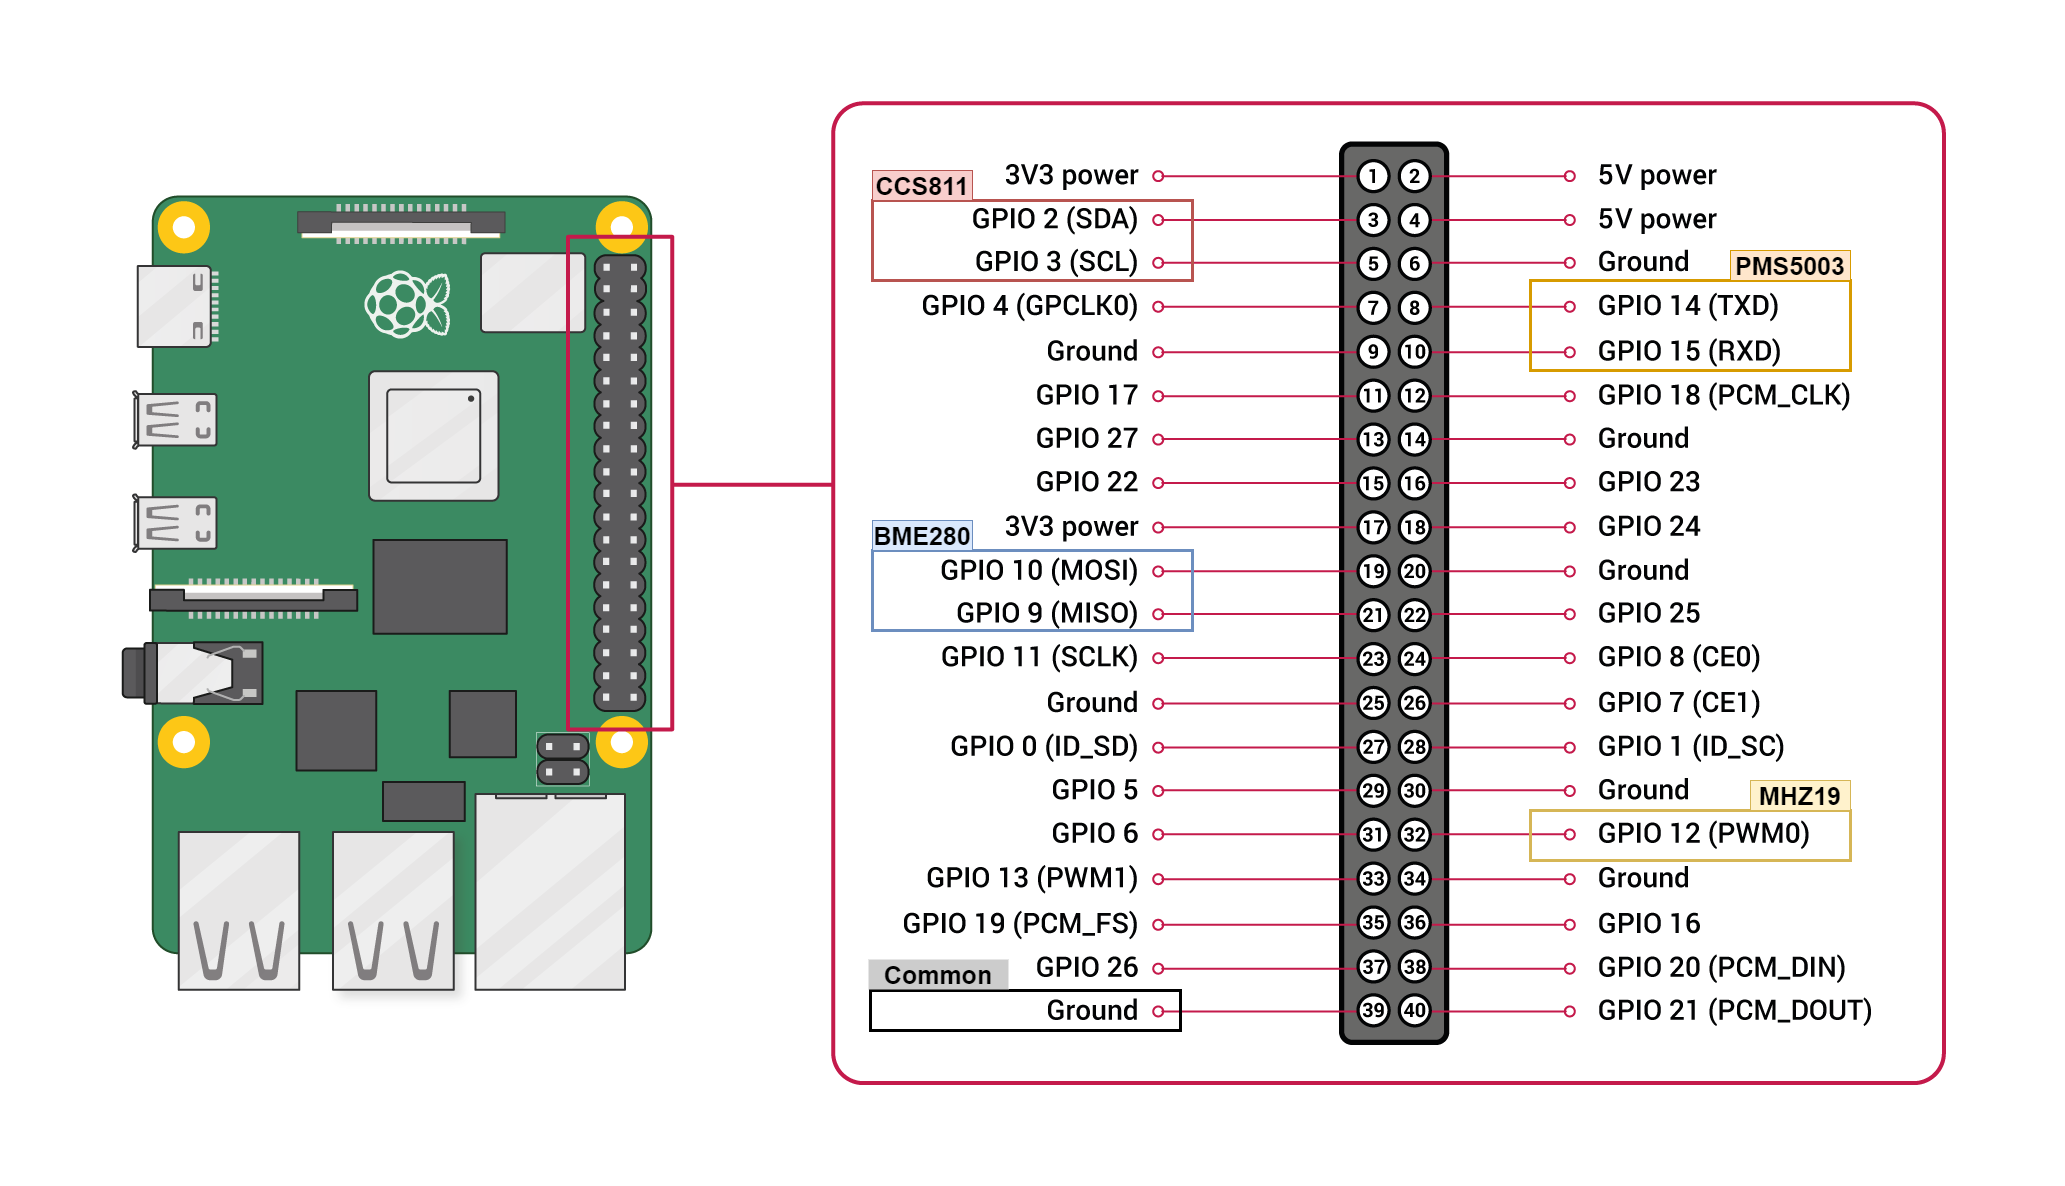
In the figure above, I have highlighted which pins will be used by each sensor, excluding the power pins. The Pi itself is connected to the external 5V power source via its micro-USB connector (or whatever other way you would like to power it).
2.1 Sensor connections
Now we delve into the connections for each sensor. Typically for each sensor, we will need to connect its power/ground pins and its data communication pins.
Power pins
Each sensor needs to be connected to a ground pin on the Pi, and a power pin. Each sensor is slightly different – some are powered from a 5V source, while other uses a 3.3V source. So – carefully checking the datasheet for each sensor – connect the power pins to the appropriate ones on the Pi (5V or 3.3V).
Data pins
Using the previous image as reference, the central requirement is that the pins used to transmit data between the Pi and each sensor must align with the communication protocol each sensor uses. Concretely:
- The CCS811 sensor will use I2C, and thus it needs to connect to the Pi’s I2C pins – in our case this is GPIO2 and GPIO3, as indicated in the figure.
- The BME280 chip we use with SPI, and so we need to connect the master and slave lines (MOSI/MISO) to the associated pins on the Pi (GPIO10 and GPIO9 in our case).
- The PMS5003 uses UART, so we need to connect its UART TX to the Pi’s RX GPIO15 pin and the PMS5003 UART RX to the Pi’s TX GPIO14 pin.
The precise pinout on each sensor which correspond to the each of the pins discussed above might change – so just consult each datasheet and make sure match the pinout for your chip to the right pin on the Pi.
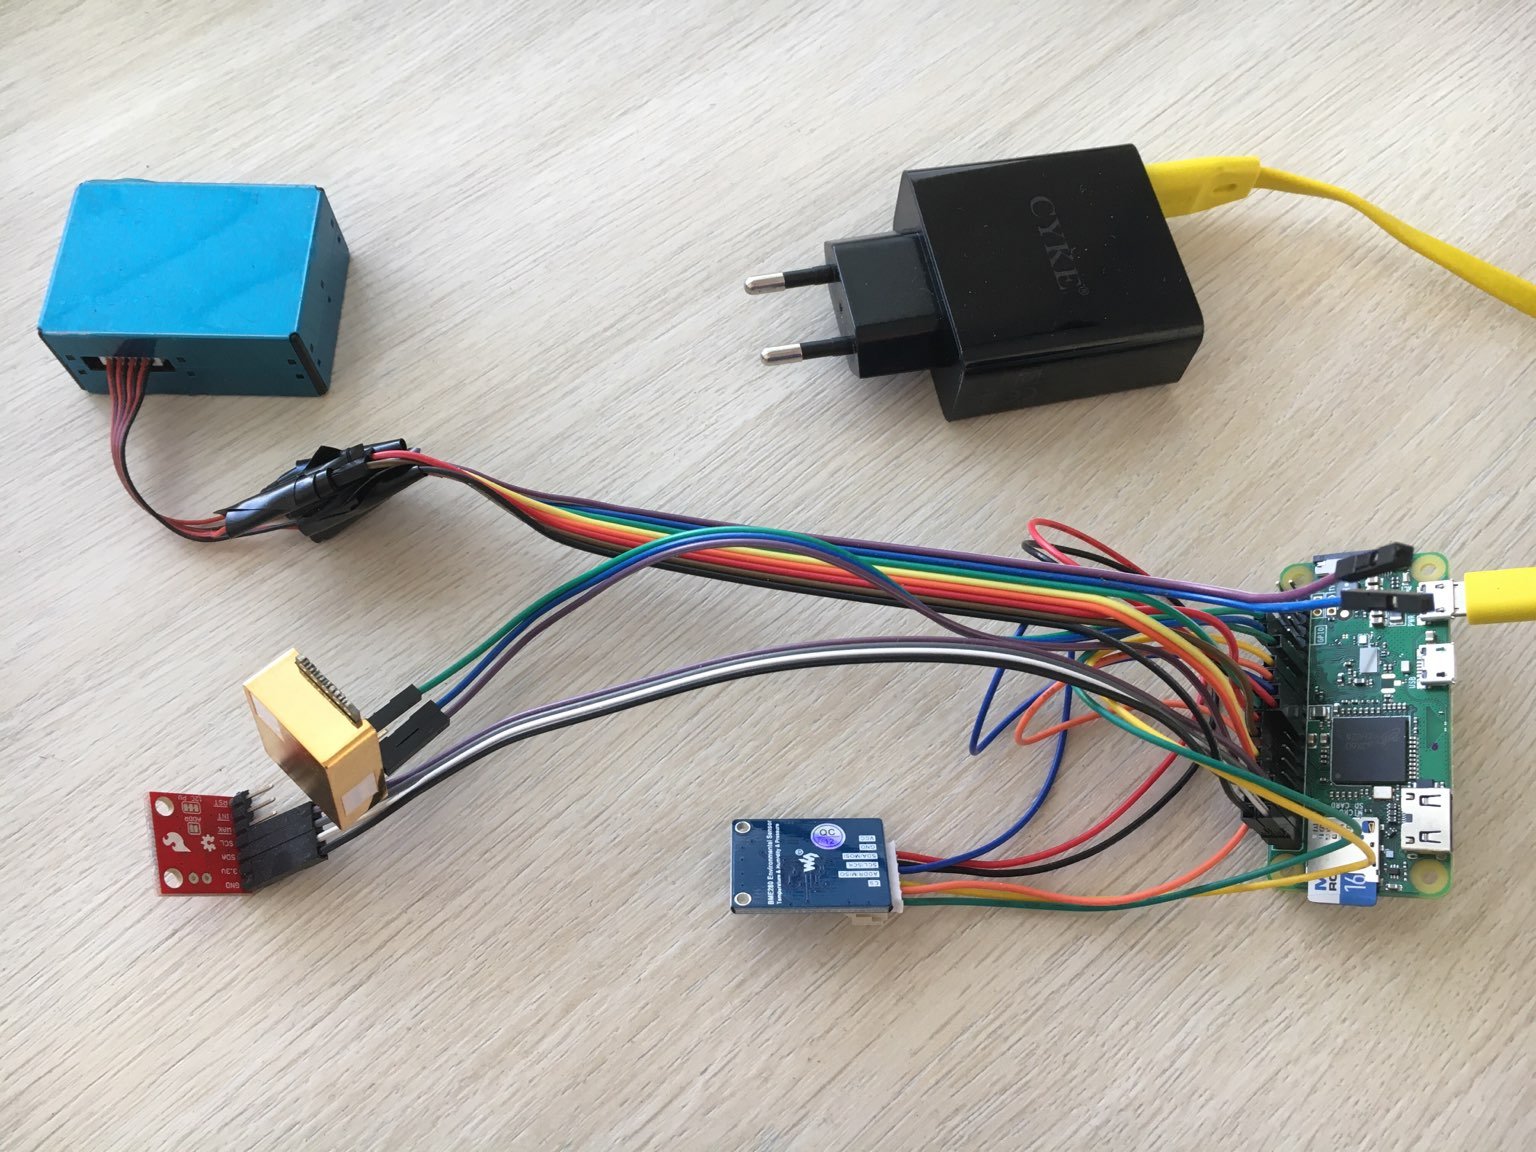
That is actually all that is required for the core functionality! Not too bad. Here is what it looks like once it’s all connected:
2.2 Casing [OPTIONAL]
If you have a 3D printer, you can model a nice case for the entire contraption in your modelling software of choice (I used Blender because it is free, has no weird DRM or shenanigans, and is available on steam).
If the physical layout of your sensors or Pi is different to the ones I have used here, you will unfortunately need to make your own casing model. The process I followed to make mine was fairly simple (as I have not much experience in 3D modelling):
- Search online for 3D models for a casing for each sensor, or a direct model of each sensor.
- Add these all to blender
- Make a dead-simple box with a separate spot in it for each sensor and the Pi, using the existing 3D models to size the casings needed for each part, or just attaching the casing directly to the box model if it already fit nicely.
Aside: A big thanks to the manufacturers and random people on the internet who provide 3D models for the sensors (or their casings). In the interest of saving time I used others’ models as much as I could, so bless those people.
Then, I exported the model as a STL file, sliced it with a slider configured for the 3D printer I had access to, and then printed it!
For reference, here is the blender file I used: link to blender case.
3. Local software implementation
In this section I’ll go over the software setup on the Raspberry Pi device. It is all done in python, and I use as many device communication libraries as possible to minimize setup time.
3.1 Raspberry Pi basics
There are many great resources online about how to set up a raspberry pi (such as this one), but the TL;DR:
- Download raspbian OS to your PC, flash it to a micro-SD card.
- Edit some config in your micro-SD card to make the Pi connect to your wifi on boot (you can skip this if using an ethernet cable).
- Login (with a screen, keyboard, and mouse plugged into the Pi, or via SSH) to the Pi.
- Install Python 3 with the appropriate command.
- Install the required libraries:
pip3 install requestspygpio, see instructions herepip3 install pms5003pip3 install Adafruit-BME280circuitpython: install with instructions given here, but TL;DR:pip3 install Adafruit-Blinka. You may need some additional setup for the right circuitpython stuffs if a new version breaks something.
3.2 Reading from sensors
The general plan to read the data from each sensor is as follows:
- Have a class which handles each sensor
- The class for a sensor uses the recommended library method to communicate with the sensor and read its values
- The values for each sensor are then smoothed and parsed in a central management class.
Let’s briefly go over the method to read data from each sensor, where I will leave the details to the library docs for each sensor (see docs for each of the package requirements above).
BME280
For the BME280, I directly use the circuit python code, and it is fairly simple and clean:
import time
import pigpio
import board
import busio
import digitalio
import adafruit_bme280

...
pi = pigpio.pi()
...

class BME280():
  def __init__(self, pi, weighting=0.0, SPI=True):
    self.pi = pi
    # Setup SPI communication
    self.spi = busio.SPI(board.SCK, MOSI=board.MOSI, MISO=board.MISO)
    self.cs = digitalio.DigitalInOut(board.D0)
    self.bme280 = adafruit_bme280.Adafruit_BME280_SPI(self.spi, self.cs)
    # Setup recommended settings for indoor use
    self.bme280.iir_filter = adafruit_bme280.IIR_FILTER_DISABLE
    self.bme280.mode = adafruit_bme280.MODE_FORCE
    self.bme280.overscan_humidity = adafruit_bme280.OVERSCAN_X2
    self.bme280.overscan_pressure = adafruit_bme280.OVERSCAN_X2
    self.bme280.overscan_temperature = adafruit_bme280.OVERSCAN_X2

  def get_sensor_readings(self):
    """ Gets the pressure in kPa, temperature in Celsius, and humidity in percent """
    temp =  self.bme280.temperature
    hum = self.bme280.relative_humidity
    pressure = self.bme280.pressure # in hPa
    altitude = self.bme280.altitude
    return temp, hum, pressure/10.0, altitude
Now we just call get_sensor_readings to obtain the latest measurements – quite simple.
CCS811
For this sensor I adapt this github gist with the following function to collate measurements:
  def get_sensor_readings(self):
    st = time.time()
    while time.time() - st < 1.1:
      # wait at most 1.1 second for new reading
      if self.data_available():
          self.read_logorithm_results()
          if self.CO2 > 2**13 or self.tVOC > 2**13:
              continue # make sure no bs errors
          return self.CO2, self.tVOC
      elif self.check_for_error():
          self.print_error()
      time.sleep(0.02) # sleep for 20ms
    raise ValueError("Could not read values in time!")
I also set the CCS811_ADDR to 0x5B , which corresponds to the specific SPI address of the particular sensor – this can usually be found in the datasheet.
PMS5003
Again, I use the pms5003 python library to make a simple class to read the data with a function:
import time
from pms5003 import PMS5003

PMS5003_SET_PIN = 23 # GPIO pin 23
PMS5003_RESET_PIN = 24 # GPIO pin 24

class PMS5003Link():

    def __init__(self, pin_enable=PMS5003_SET_PIN, pin_reset=PMS5003_RESET_PIN):
        self.pms5003 = PMS5003(device='/dev/ttyAMA0',
            baudrate=9600,
            pin_enable=pin_enable,
            pin_reset=pin_reset
        )

    def get_readings(self):
        data = self.pms5003.read().data
        pm1_0 = data[3] # PM1.0 ug/m3 (ultrafine particles):
        pm2_5 = data[4] # PM2.5 ug/m3 (combustion particles, organic compounds, metals)
        pm10 = data[5] # PM10 ug/m3  (dust, pollen, mould spores)

        conc_g0_3 = data[6] # >0.3um in 0.1L air:
        conc_g0_5 = data[7] # >0.5um in 0.1L air:
        conc_g1 = data[8] # >1.0um in 0.1L air:
        conc_g2_5 = data[9] # >2.5um in 0.1L air:
        conc_g5 = data[10] # >5.0um in 0.1L air:
        conc_g10 = data[11] # >10um in 0.1L air:

        return pm1_0, pm2_5, pm10, conc_g0_3, conc_g0_5, conc_g1, conc_g2_5, conc_g5, conc_g10
MHZ19
Finally, for the CO2 sensor, I combine this script to read a PWM signal level with the following functions to adapt it for the CO2 measurement:
  def parse_co2_measurement(self):
      """ Parses sensor co2 measurement into a ppm float number"""
      f = self.frequency()
      pw = self.pulse_width()
      dc = self.duty_cycle()

      period_ms = 1000/f
      # convert microsecond pulsewidth --> ms
      pw_ms = int(pw + 0.5)/1000.0
      co2_ppm = to_co2_reading(pw_ms, period_ms)
      return co2_ppm

  def to_co2_reading(high_period_ms, total_pwm_period_ms):
      co2_ppm = 2000*(high_period_ms - 2)/(total_pwm_period_ms - 4)
      return co2_ppm
Bringing the readings together
Now each sensor has a function to obtain the readings.
So now in a central class we instantiate the pi = pigpio.pi() object and each sensor class. Then, at a high level, it:
- Defines a linear interpolation / LERP function which is used to smooth values. The specific LERP weighting I set to 0.5 after seeing how noisy most of the measurements were – this helped ensure things remain smooth and any jumps observed in sensor readings are not just noise or random spikes.
- Has a central while loop which runs every 5 seconds, sampling from each sensor, applying the linear interpolation between the current and previous reading for each sensor, and storing this latest smoothed reading into a list for logging.
- Logs the last 10 samples for each sensor to a log file every 10 samples (= every 50 seconds)
- Sends the latest sample to the Oxide server every 60 samples (every 300 seconds)
- Has watchdog and error timeout checks to try recover when a sensor momentarily doesn’t respond in time.
That’s it! It is fairly easy to see how this can be adapted to sending the data anywhere or using it for other display paths, like a local django/flask server or similar. But, for myself, I wanted some nice mobile applications so next I detail the Oxide setup.
3.3 Sending data to server
This part of the code is exceedingly trivial. I used the requests package and then simply indexed the last read sample in the main class, and sent a POST request to the url endpoint set up in Oxide (discussed later) with the payload containing the read samples and authorization header to authenticate my request.
Done! That is everything for the local side; all that is left is to code up the server endpoints/database, and front-facing app to show the sensor readings.
4. Oxide implementation
For the backend server and mobile/desktop applications I use Oxide. It is a browser IDE that also comes with database and mobile/desktop application support with minimal setup – which is necessary since I am not too experience with mobile app development. As mentioned before, you can use another backend setup if it works better in your situation.
So for this Oxide project, I make use of 3 main aspects of Oxide:
- The database and data model functionality
- The frontend javascript app functionality
- The CloudCode API functionality for the Raspberry Pi to relay sensor readings.
I go over each of these next, starting with the project setup.
4.1 Project setup
Put simply:
- Go to JourneyApps Oxide website and setup an account.
- Create an app, use whatever version control suits your needs (in my case I just used
revisionssince this is a small project) - Proceed through the steps for creating an app, selecting the
Blanktemplate.
That’s it.
4.2 Database setup
Now that you are inside the Oxide editor, let’s proceed to the Data model to setup the database.
For my simple application, I just want the database to store the last few days of sensor readings and only on my phone/desktop – feel free to deviate at any step if you have other cool ideas.
Now, in the Data model GUI editor, you should already have a User and Push Notification model.
To add a data model object for sensor readings, add the following lines to the schema.xml file:
    <model name="sample" label="Sample">
        <field name="co_2_ppm" label="CO2ppm" type="number" />
        <field name="eco_2_ppm" label="eCO2ppm" type="number" />
        <field name="tvoc_ppb" label="TVOC_ppb" type="number" />
        <field name="timestamp" label="timestamp" type="datetime" />
        <field name="temp_c" label="temp_C" type="number" />
        <field name="pressure_kpa" label="pressure_kPa" type="number" />
        <field name="humidity_perc" label="humidity_perc" type="number" />
        <field name="particles_0_3" label="particles_0_3" type="number" />
        <field name="particles_0_5" label="particles_0_5" type="number" />
        <field name="particles_1" label="particles_1" type="number" />
        <field name="particles_2_5" label="particles_2_5" type="number" />
        <field name="particles_5" label="particles_5" type="number" />
        <field name="particles_10" label="particles_10" type="number" />
        <field name="pm_1" label="pm_1" type="number" />
        <field name="pm_2_5" label="pm_2_5" type="number" />
        <field name="pm_10" label="pm_10" type="number" />
        <belongs-to model="user" />
        <display>Sample</display>
    </model>
This will add a Sample data model object, where each sample is linked to a specific user, and each Sample contains a value for all sensor readings at a particular time. I.e. it is one sample received from the Raspberry Pi.
4.3 receiving sensor data
Now that the database is sorted, we need to allow Oxide to receive samples from the Raspberry Pi.
To do this, we will use the CloudCode feature of Oxide – which is essentially a kind of NodeJS server.
It offers a bunch of additional features as discussed in their docs, but we only need a single API endpoint for the raspberry pi to send the samples to.
To make such an endpoint, in the CloudCode editor tab of Oxide:
- Create a CloudCode task using the
Default JStemplate. - Add the basic functions for an authenticated POST request, as given in these code blocks in the docs.
- Add the following lines to the body of the
post()function:const body = await request.json(); let sample = DB.sample.create(); sample.timestamp = new Date(); sample.co_2_ppm = body.CO2_ppm; sample.eco_2_ppm = body.eCO2_ppm; sample.tvoc_ppb = body.tVOC_ppb; sample.temp_c = body.temp_C; sample.humidity_perc = body.hum_perc; sample.pressure_kpa = body.pres_kPa; sample.pm_1 = body.pm1_0; sample.pm_2_5 = body.pm2_5; sample.pm_10 = body.pm10; sample.particles_0_3 = body.conc_g0_3; sample.particles_0_5 = body.conc_g0_5; sample.particles_1 = body.conc_g1; sample.particles_2_5 = body.conc_g2_5; sample.particles_5 = body.conc_g5; sample.particles_10 = body.conc_g10; await sample.save(); response.status(200); - Allow web requests to the CloudCode function. To do this, right-click on the task in the sidebar -> CloudCode task settings -> toggle
Web Requestson. - Hit the
deploy to testingbutton. Your endpoint will now be available athttps://<your_app_deployment_hostname>.poweredbyjourney.com/<cloudcode_task_name>
All that’s left is now to make the frontend application to view the sensor readings.
4.4 Font-end app
For the frontend app, I use Chart.js for graphs, and pure HTML with typescript. I’ll spare you the spam of a page full of HTML and Typescript and just link the HTML file here and the typescript file here.
In short, the application contains a button to update the data and an iframe to display the graphs. This is because the prefab assets supported by Oxide at this time does not include graphs, so we must use an iframe with custom HTML to make them. The HTML file links with the typescript functions using the JourneyIFrame client as shown in the HTML file. To setup this frontend in the Oxide editor, the steps are again fairly trivial:
- Go to the
Assetstab, and add the HTML file as an html asset by right-clicking thehtmlfolder in assets and hitting Upload assets. - Go to the
Viewstab in Oxide, hitctrl-shift-pand run theConvert project to TypeScriptcommand. - Again in the
Viewstab, replace themain.tsfunction with the typescript file provided earlier. - Finally, add the following 3 lines inside the
viewtag of themain.view.xmlfile:<var name="sample_table" type="query:sample" /> <button on-press="$:buttonPress()" label="Update" type="primary" /> <html src="html/<name of uploaded html file>.html" show-fullscreen-button="false" height="$:size_canvas()" />
And that’s it! Now hit the deploy to testing button and it should be live. You can download the JourneyApps container from the app store on iOS/Android, or view it on the web by hitting ctrl-shift-p and searching for Test on web.
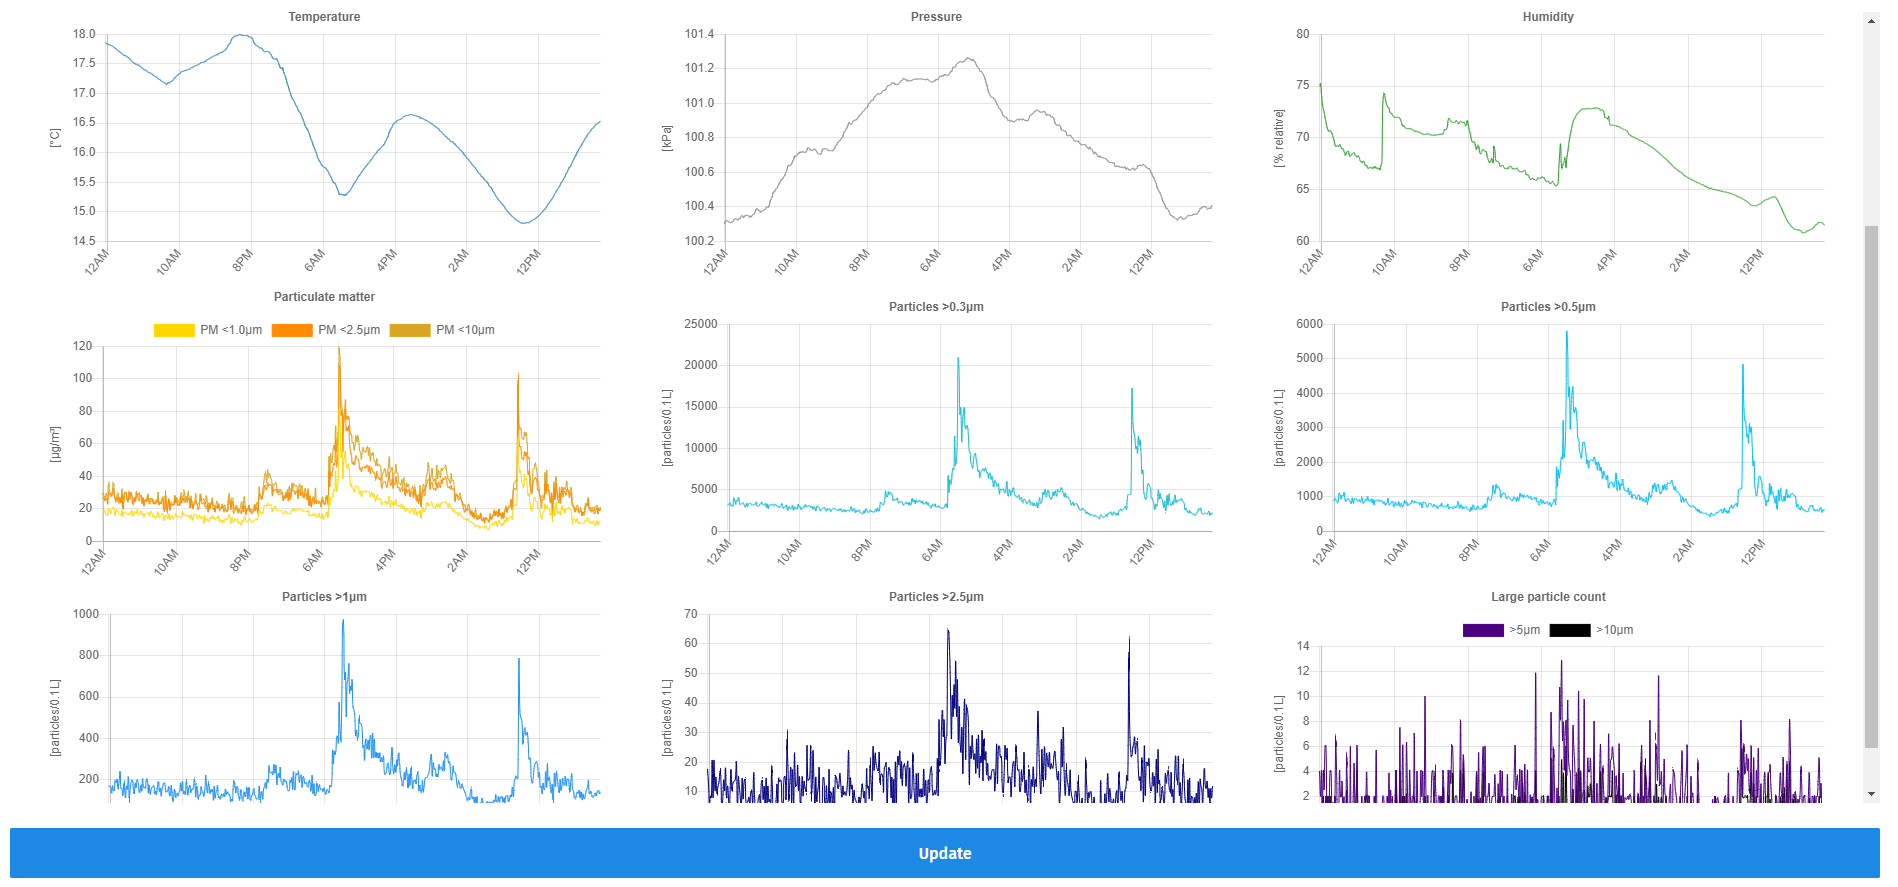
Here is what it looks like on desktop:
And on an iPhone:
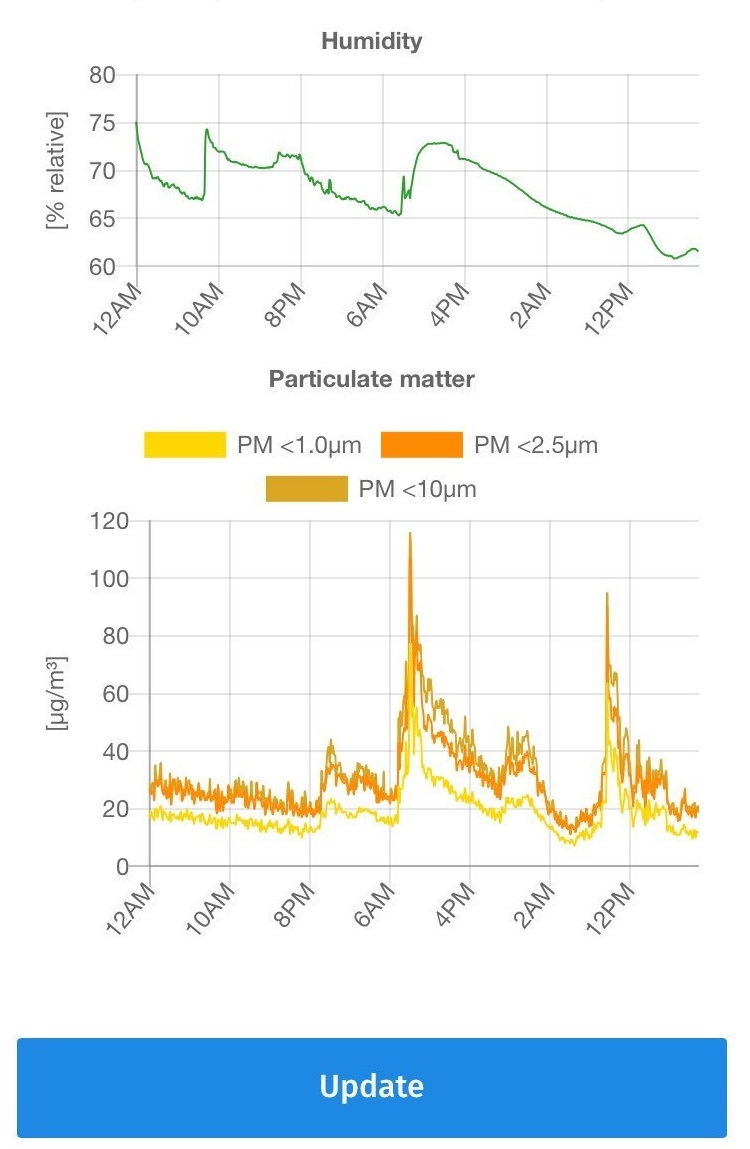
Each graph shows a different sensor readings (or set thereof for grouped readings like PM1, PM2.5, PM10) for the last three days, and is updated whenever the Update button is hit or the app is opened. Pretty neat :).
5. Summary
So, after all this effort, we now have a small, portable device that can measure 14 different air quality related values, relay these to a server, and then display it for us on a desktop and mobile app.
And all of this without any additional hardware parts other than the base IC chips – which is often not the case. Often when combining several sensors one needs additional pull-up or pull-down resistors or other supporting circuity to make things work nicely (e.g. an op-amp is often necessary for audio or current measurement sensors). Whereas in this project, all we needed were the sensors themselves and some wires.
Similarly, the server setup was fairly trivial – no IDE installs or dealing with Apple or Google Inc to get a mobile app up an running, and just an overall very short time to get things working.
Conclusion
I hope you found this half-documentation-half-guide on making a home air quality sensor useful, should you ever think of making such a sensor yourself. I can highly recommend it over nearly all the air quality sensor hubs I have seen available for purchase online.
And, lastly, may the best of air quality be upon you.
Thank you for reading, and as per usual, if you have any comments or ideas please get in touch via the About page.
tags: electronics - air quality - raspberry pi - python - typescript