M Baas
I am a machine learning researcher at Camb.AI. I post about deep learning, electronics, and other things I find interesting.
A time series dataset of the South African 2024 general election
by Matthew Baas
A fully labelled time series dataset of the vote counts and associated data from the South Africa 2024 general election, along with some preliminary analysis.
TL;DR: In May 2024 South Africa had a general election, which it has once every five years. Analytically, the actual time series contains the vote tallies at the provincial and national level over the counting period until the results are declared. Such a time series can be quite useful. For example, the relative performance and counts of parties as the voting proceeds gives good signals into election integrity, efficiency, and any possible anomalous events. To the best of my knowledge, there exists no such public dataset of the 2024 or prior general elections. I present such a dataset here for the 2024 general elections.
1. The dataset
In South Africa, a single national government body manages elections. The ostensibly independent Independent Electoral Commission (IEC) handles everything from voter registration, management of polling stations, counting, and final declaration of results. On the night of the election on the 29th May 2024 and in the few days following, they made available a live results dashboard at this link. This link showed live updates for vote counts for both the national and provincial government elections.
Observing the network requests on the results dashboard reveals several API calls to grab the current results, namely calls to get the party list, and vote counts for each party for each voting district.
For the 2024 election, these were mostly of the form https://results.elections.org.za/dashboards/npe/MapsJason/2024/<SPECIFIC API ENDPOINT>
For general elections in South Africa, people vote for both national and provincial parties on the same day at the same time. The vote results are tallied from the most local level to the final national count (or provincial count for provincial election). Election results are grouped geographically by the IEC, in the following hierarchy:
Voting district: smallest area reported by the IEC online, typically only 1 voting station per VD, e.g. a suburb.
↓
Wards: typically a group/cluster of geographically contiguous voting districts, e.g. a group of similar suburbs
↓
Municipality: a cluster of several adjacent wards, typically encompassing a town and the surrounding area
↓
District: a cluster of adjacent municipalities, or one metro municipality. e.g. a large city, or a large fraction of a province
↓
Province: a cluster of adjacent districts, one of the 9 current provinces of South Africa.
↓
Nation: a cluster of provinces, the entire nation of South Africa
On the day of the election, before counting started, I began collecting the responses of all the public IEC API calls, once every 10 minutes until the counting finished and final results were declared. The dataset is simply the data returned from these API calls to the official election results website, just formatted for easier data analysis.
1.1 Data download
The data is available to download as a single zipped file on my gitub here:
Data download link:
https://github.com/RF5/Experiment-K/releases/download/za-2024-election-timeseris/
Inside the zip file is all the text and jsonl files containing the election data, described below.
1.2 Data format
The data is split into two sets of files. The first set is static metadata, about things that do not change as vote count proceeds. This includes the list of contesting parties, and information about all the voting districts, municipalities, and provinces. The second set is information that changes with time – namely the provincial and national vote counts every 10 minutes for every voting district.
NOTE: some of the columns have slightly a mysterious meaning that is unclear to me, and naming that is sometimes seemingly illogical. However, these are the direct namings and values returned from the IEC results dashboard API calls, so I opt to keep them to provide the data as close to the source as possible.
Non-time-varying data:
- A
parties.csvfile, containing a list of each party contesting a national or provincial election, along with details about the party. Concretely, the columns are:ID: used to link results in all the other csvs/parquet files. This is the ID of the party in the IEC’s database.Name: Short name of the party, typically the acronym. E.g. ‘ANC’, ‘DA, ‘VF PLUS’PartyFullName: The full name of the partysWebColour: Hex color used to display the party’s votes in the live dashboardPartyImage: image name for party logosPartyFilterText: alternate names / aliases for the party (e.g. english and afrikaans names for a party)sLeaderBoardColour: other info returned by API
- A
provinces.csvfile, containing information about every province. The fields available are:FID_1: unknown, appears to just be a unique counterProvinceId: the ID of the province, key used to reference provinces in other files.Province: name of the province (e.g. “Northern Cape”)PROVCODE: 2-letter code for the province, e.g. “NC”natid: ID of the nation to which the province belongs, 1 indicating South Africa. Currently, all values are 1. One can speculate as to why this is here, or when it was used…
- A
municipalities.csvfile, containing a list of the municipalities. The columns present are:FID: unknown meaningCATEGORY: either ‘A’ or ‘B’. ‘A’ indicates a metropolitan municipality (typically a municipality with a large population situated in a big city), or ‘B’, which indicates a regular municipality.DISTRICT: district to which the municipality belongs. Each metro municipality is its own district, but non-metro municipalities may belong to the same district, which is grouped by geographical area. This is the name of the district.Municipali: name of the municipality along with its unique code, separated by a hyphen. e.g. “NC073 - EMTHANJENI” (northern cape district seventy-three, name Emthanjeni)MunicId: unique ID of the municipality, usedProvId: ID of the province to which the municipality belongsProvincId: same values as ProvID :/ProvCode: 2-letter province code, e.g. “WC”DCId: district ID to which the municipality belongsMunicCode: unique code of each municipality, e.g. “WC033”.Province: string name of the provincenatid: nation of the province
- A
voting_districts.csvwhich gives information about each low-level voting district:Province: associated provinceMunicCode: associated municipality codeMunicipali: associated municipality nameWardId: associated ID of the ward to which this voting district belongsProvinceId: associated province IDMunicId: associated municipality IDVDNumber: voting district ID (lowest level information)
Time-varying data:
national_detailed_results.jsonl: a jsonl file (a text file where every line is a string of valid json) where every line is a dump from the IEC API for the national government election, in chronological order. Each line looks like:ElectoralEventID <class 'int'>ReportDate: <class 'str'>datetime when the current reports were generated. Note these are the same for multiple rows since I sample the API at a higher frequency than IEC typically updates their numbers/reports.ProvinceResults <class list>: list of 9 dicts, each giving a provincial breakdown of votes for each party.PartyBallotResults <class list>: list of parties and the total amount of votes they have received nationally, e.g.{'ID': 7, 'TotalValidVotes': 6273017, 'PercOfVotes': 40.23, ...}, where ID is the party ID.VotingDistrictResults <class list>: list of voting districts, specifying the leading party for each voting districtVDExpected <class 'int'>: total number of voting districtsSeatsExpected <class 'int'>: always 200, number of seats in the electionVDsComplete <class 'int'>: number of completed voting districtsSeatsComplete <class 'int'>: total number of parliament seats declaredPerc_Complete <class 'float'>: percent of votes counted (read: percent of voting districts reporting their final numbers to IEC headquarters).RegisteredVoters <class 'int'>: number of registered votersTotalVotesCast <class 'int'>: total votesValidVotesCast <class 'int'>: valid votesSpoiltVotes <class 'int'>: spoiled votesSpecialVotes <class 'int'>: special (e.g. early) votesPercentagePoll <class 'float'>: unsure
provincial_results.jsonl: a jsonl file where every line is a dump from the IEC API for the provincial government elections, in chronological order. The dict always has 9 keys, mapping each province name to the provincial results for that province. The format of each of the provincial results are identical to that of the national results detailed above.
1.3 Notes
Some of the lines in the .jsonl files are identical because I sampled the IEC APIs once per 10 minutes or so, but the IEC only updated their data around once per hour, although this was a bit inconsistent.
So, between two timestamps where the IEC updates their numbers, all the scraped API results (i.e. lines in the jsonl file) are identical.
2. Preliminary analysis
Here I try to look into the data a bit and get a feel for how the election went, and any trends that appear. To simplify my analysis, I make the following restrictions:
- I will restrict my analysis to the top 8 parties. The raw data contains vote counts and information on all contesting parties, but beyond the 8th party, the vote shares drop off precipitously.
- I will only consider data between when the counting started (first results reported), up to when the vote count was over 99.9% complete, since the last 0.1% does not significantly affect results and took substantially longer to finish, making the plots less clear.
- I use the short names for parties in this analysis, but their full names are in the
parties.csv.
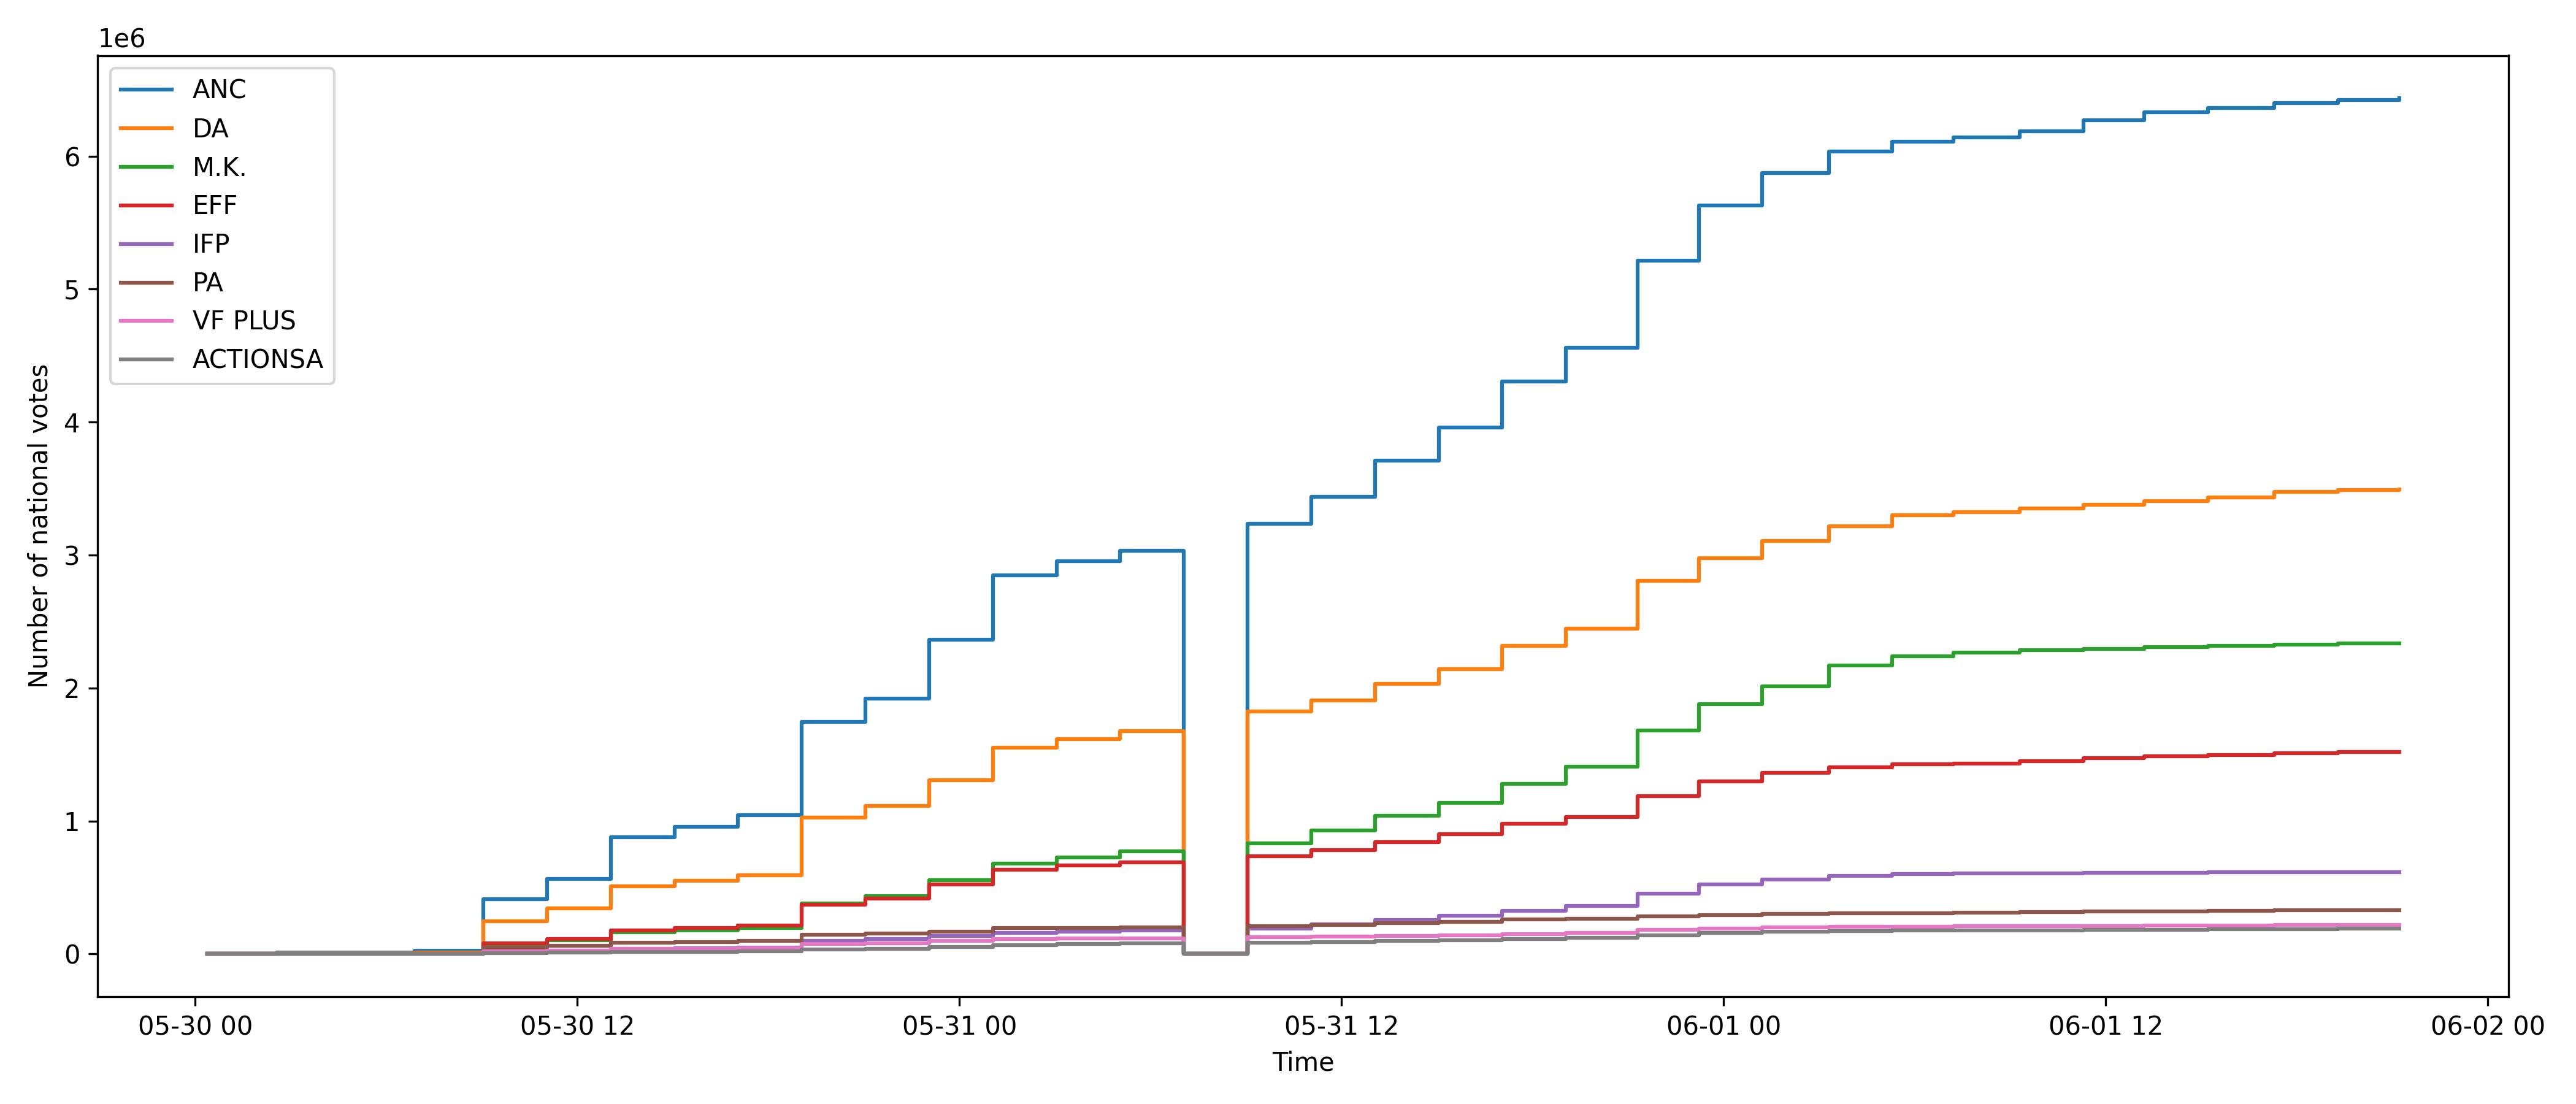
First, here is the headline results:
Figure 1: Plot of votes by party over time for the national election.
And the provincial results for all 9 provinces:
Figure 2: Plot of votes by party over time for the provincial elections.
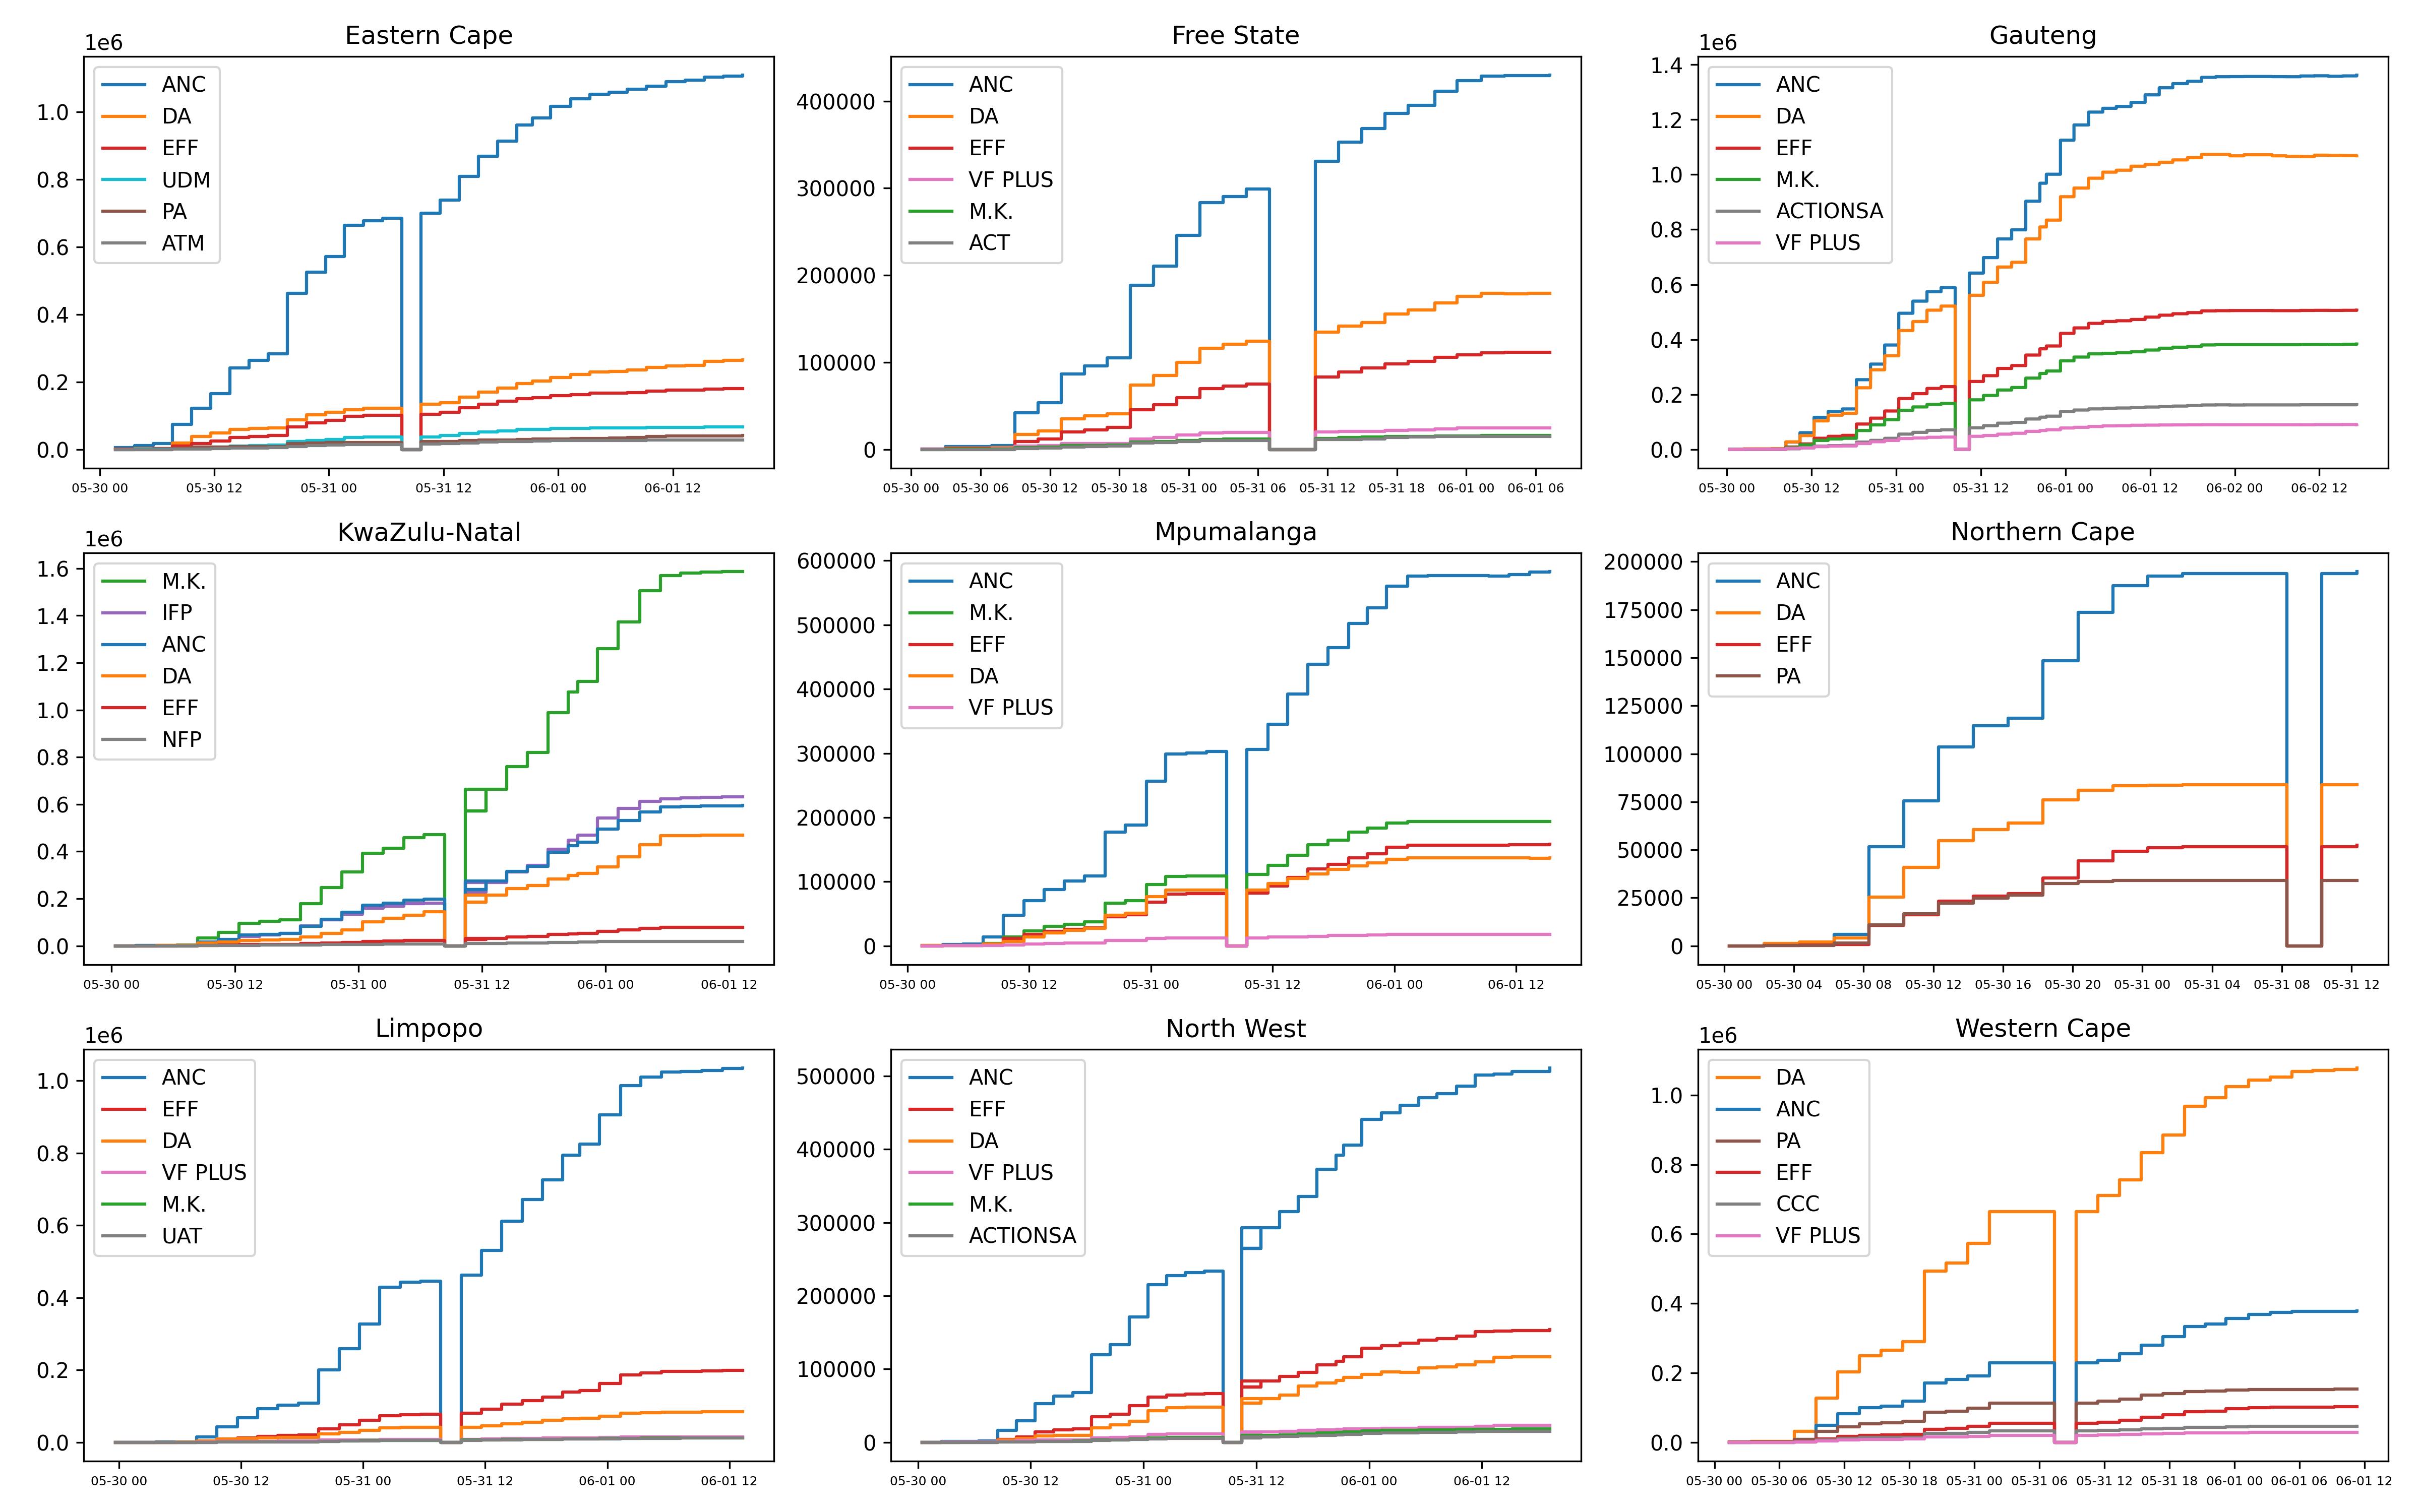
The first observation you may see is that nearly all the results drop to zero around 1 day into the counting of votes. This was due to the IEC having a national outage on their results dashboard during these few hours (and later on for their Northern Cape results). During this time, their APIs returned zero votes for all parties for some reason, and their live dashboard was broken. While suspicious, it didn’t seem to affect the trend of the results and appears to hopefully just have been a front-end issue. This is the reason for the dub at the same time in all provinces.
Strangely enough, during this outage, the Northern Cape provincial results still worked, but then broke around a day later toward the end of counting, as can be seen in the graphs.
In the next few sections, I try to answer specific questions about the data to gain some more insights.
2.1 Are the early winners the same as the late winners?
By this, I mean ‘does who is winning change throughout counting?’. For example, are there any suspicious F-curves or other shenanigans where one party is leading and suddenly another party overtakes it? To see this, I plot the same results as above, but normalized to total vote counts at each instant. That is, I plot the percentage of votes so-far-counted that each party has won.
Figure 3: Stacked plot of the % vote share won by each party versus time for the national election. The corresponding percent of voting districts counted (i.e. % of votes counted) is indicated on top of the plot in red for clarity.
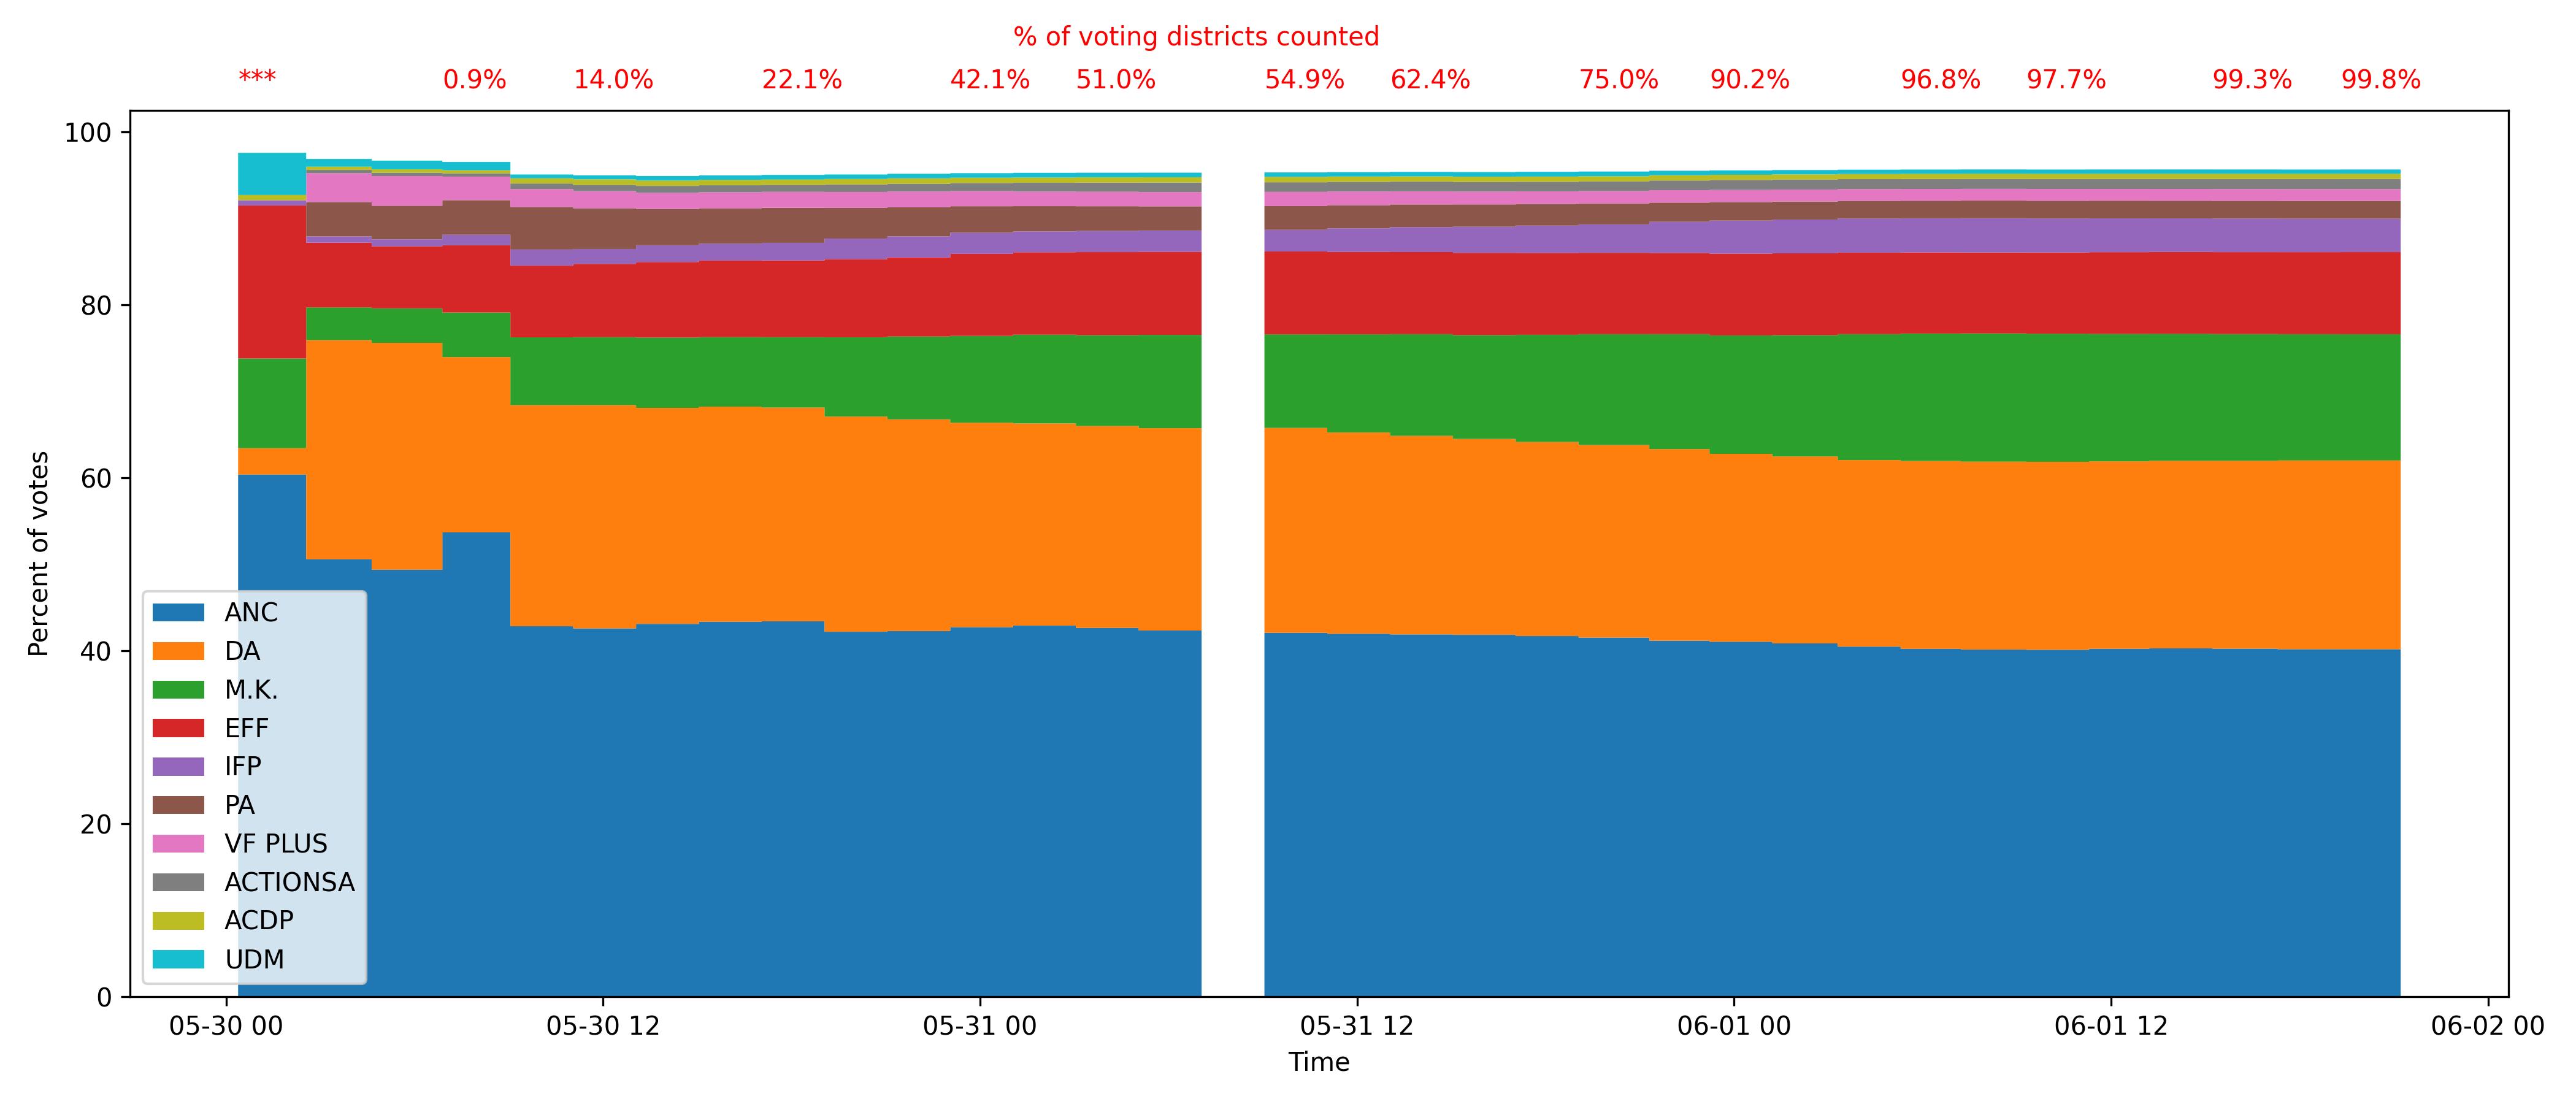
Note in the above plot, the total votes do not sum to 100% since I only am showing the top 8 parties, the remaining % is made up of smaller parties. From the above, we can see that the vote share doesn’t change too significantly after ~0.9% of the vote is counted. There is much fluctuation in the balance before that, which makes sense since there is too few votes cast before this for the numbers to be a representative sample of the whole population.
The one exception is the MK party, which steadily increases its vote share up till around 90% of the votes have been cast, seemingly at the expense of the ANC, PA, and DA. But this is slightly misleading since most of their votes were given in KZN (see Figure 3) and KZNs vote was counted slower than the provinces where the PA and DA got most of their votes. Overall, nothing too suspicious and no weird jumps.
Figure 4: Stacked plot of the % vote share won by each party versus time for the provincial elections.
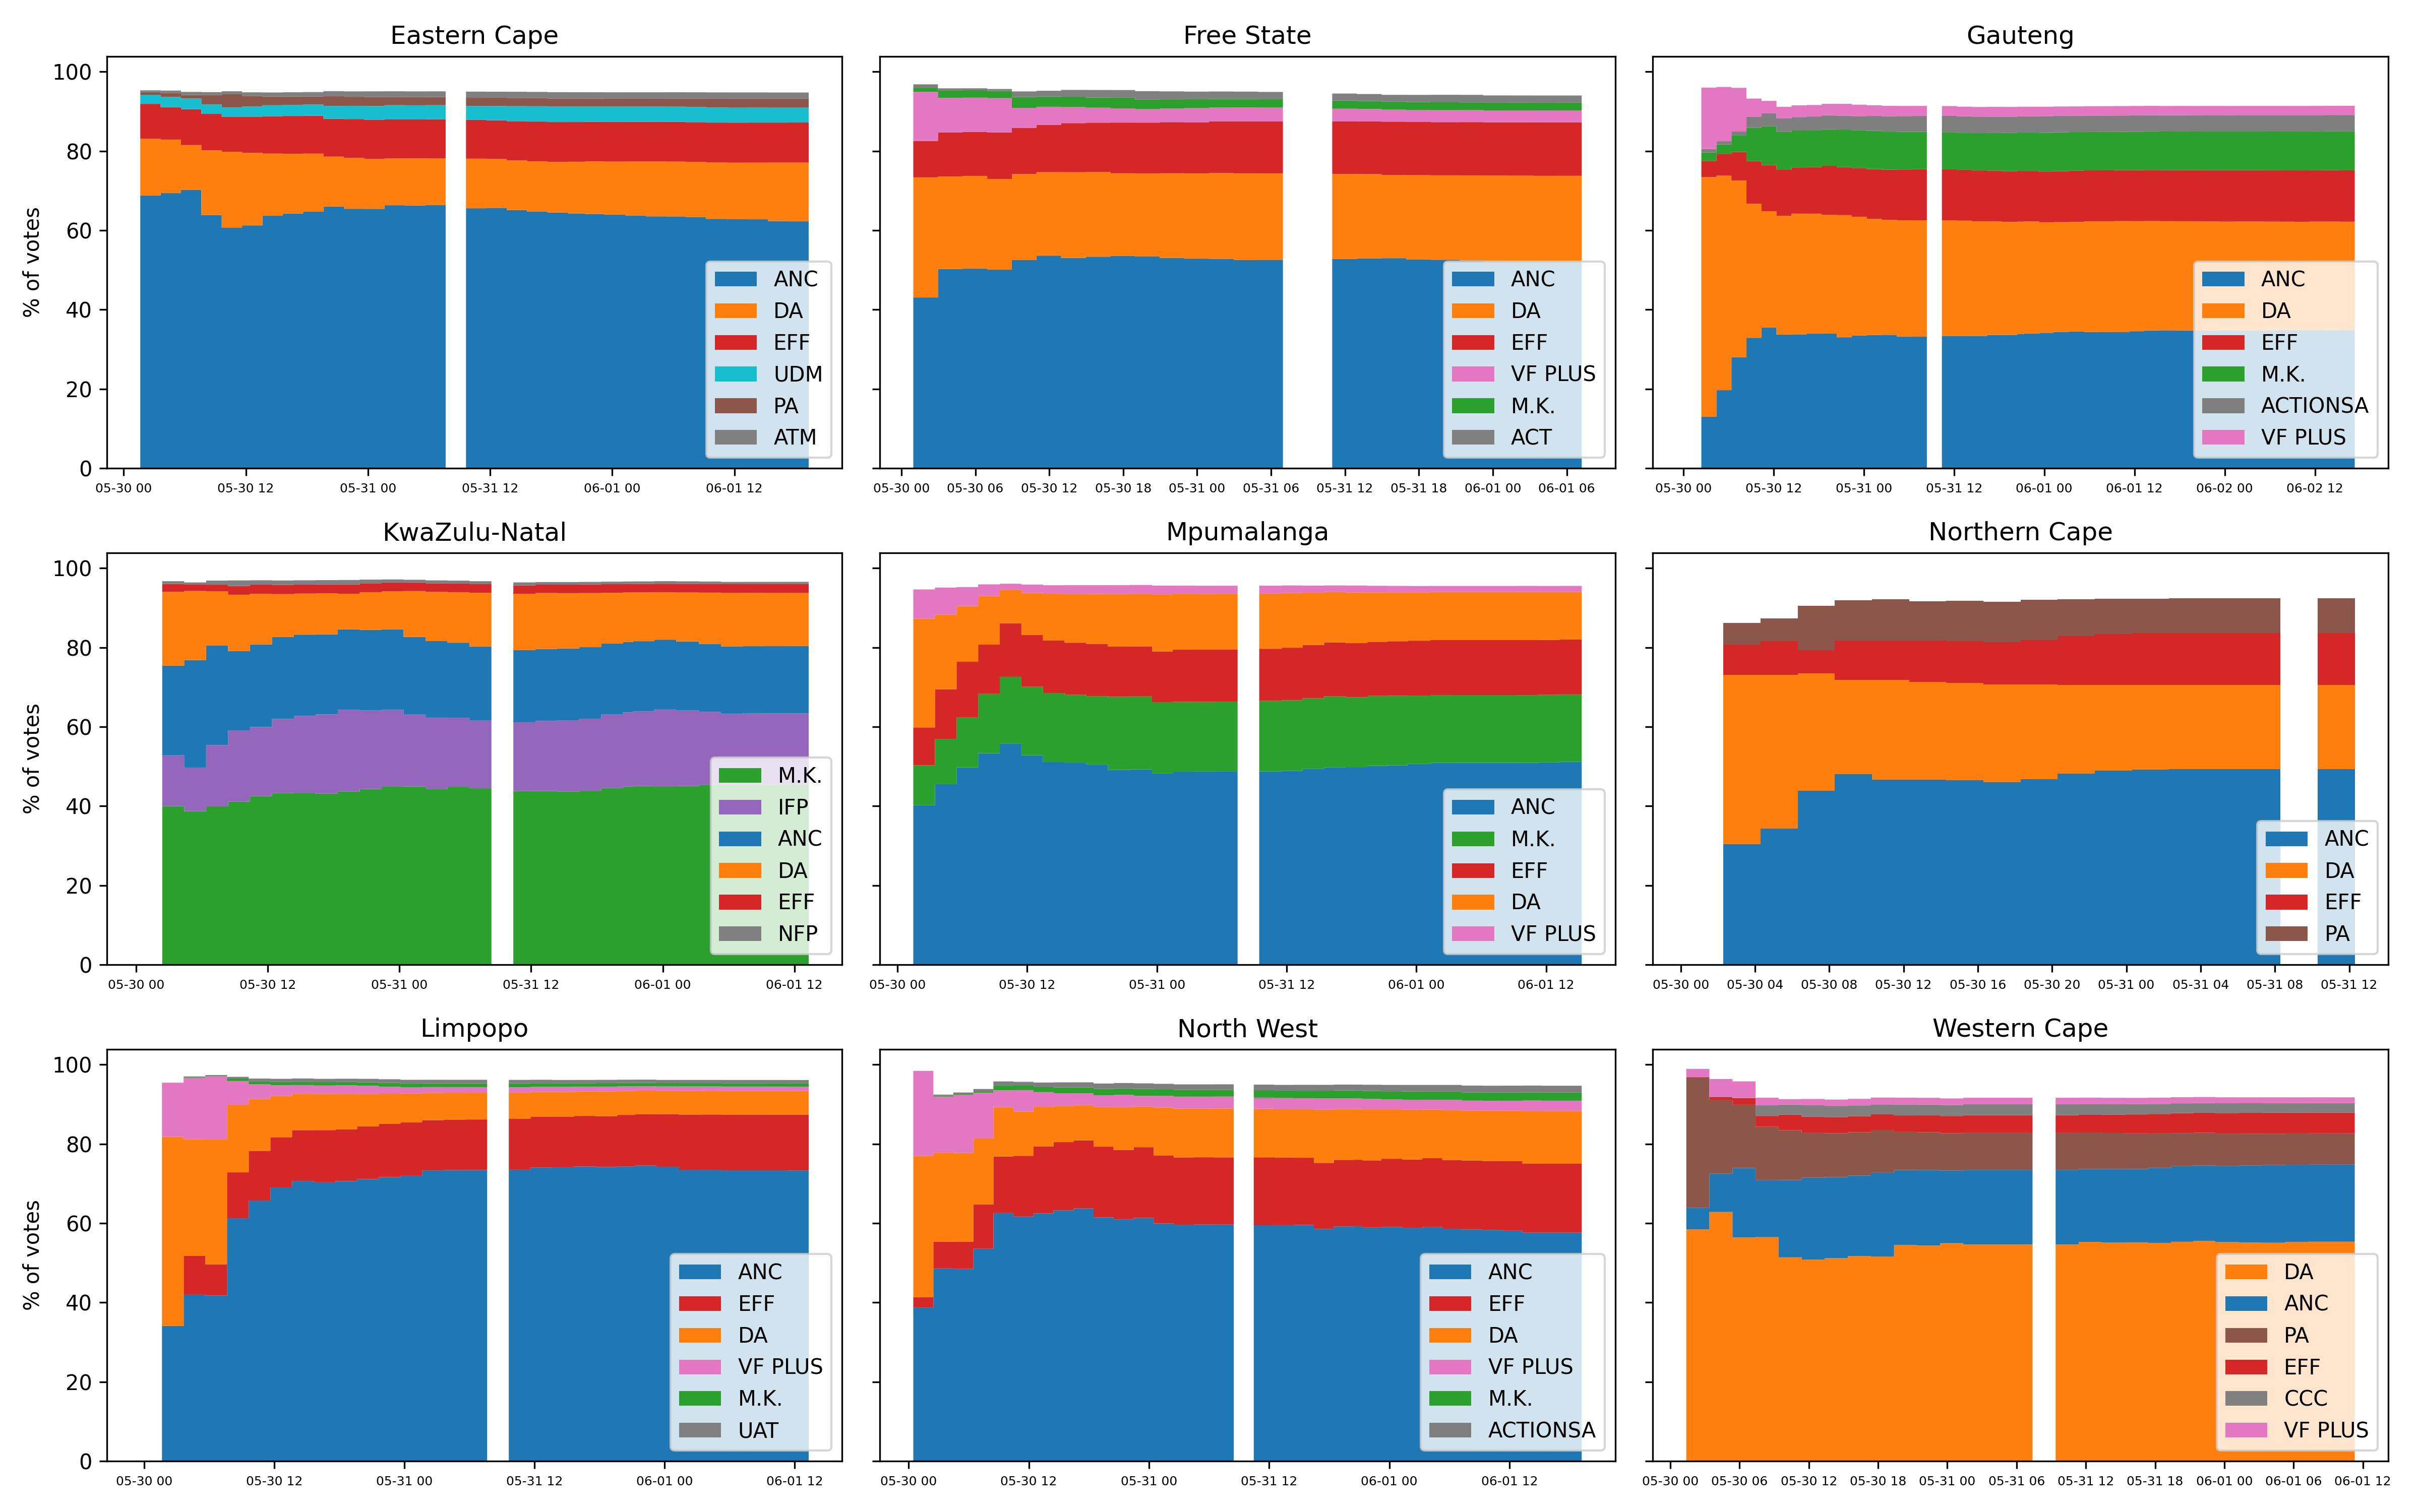
The results are similar to the national, and overall looks like a healthy election. The relative performance of each party after the first ~3% of the votes are counted is entirely indicative of their final ranking in the province. This is a good sign, indicating that each slice of votes counted is a representative sample of the whole, and there are again no sudden jumps after the first few votes are tallied.
2.2 Do the vote tallies follow Benford’s Law?
Benford’s law is a statistical law about the frequency distribution of the digit values of numbers in a base-10 number system. It states that many datasets that span multiple orders of magnitude follow an inverse distribution for digit frequency, where numbers starting with the digit ‘1’ will occur more frequently than numbers starting with the digit ‘9’.
For this, I will just do a very naive/rudimentary analysis, since typically analysis using Benford is done on the final results, and the IEC provides (as of 2024-08-10) a more detailed data dump of low-level voting district level results here. Concretely, I first estimate the first and second digit distribution using the vote counts of all parties nationally for the national election. These should definitely span multiple orders of magnitude, so we have good reason to believe it should follow Benford’s law. However, there are not more than 60 parties that achieved more than 10 votes for the national election, leaving us with very few numbers to use in estimating distributions. However, since Benford’s law of the first digit is fairly pointed, we should still see a trend there, which we plot below:
Figure 5: Comparison of the first digit in total valid vote numbers for parties contesting the national election (left), and first digit distribution according to Benford’s Law (right).

The KL divergence (a measure of the distance between two distributions, with values between 0 and 1, 0 indicating the two distributions are identical) between the two distributions is $0.127$. This is pretty good, and we can see the distributions are quite close, despite the small number of samples.
Figure 6: Comparison of the second digit in total valid vote numbers for parties contesting the national election (left), and second digit distribution according to Benfords Law (right).

The second digit is much less clear, with the two distributions not looking that similar. However, this is to be expected, since the 2nd digit distribution is much closer to a uniform random distribution, and the estimated distribution looks pretty random without much structure to it. In other words, the distributions are quite similar. This can be again measured using the KL divergence, which, for the second digit, is $0.092$ – this is even lower than the 1st digit, and indicates the distributions are more similar. Intuitively, they just look dissimilar because we (a) don’t have enough samples for the shape to match the more subtle shape variations in the 2nd digit Benford distribution, and (b) the overall distribution is much more uniform than the 1st digit Benford, and if the plot above had the same y-axis limits, the two sides would look relatively more similar.
Lastly, we look at the provincial vote similarity to Benford, in the first digit.
Figure 7: Comparison of the first digit in total valid vote numbers for parties contesting the provincial election, for each province. The KL distance to the Benford Law 1st digit distribution is given in the top right for each province.
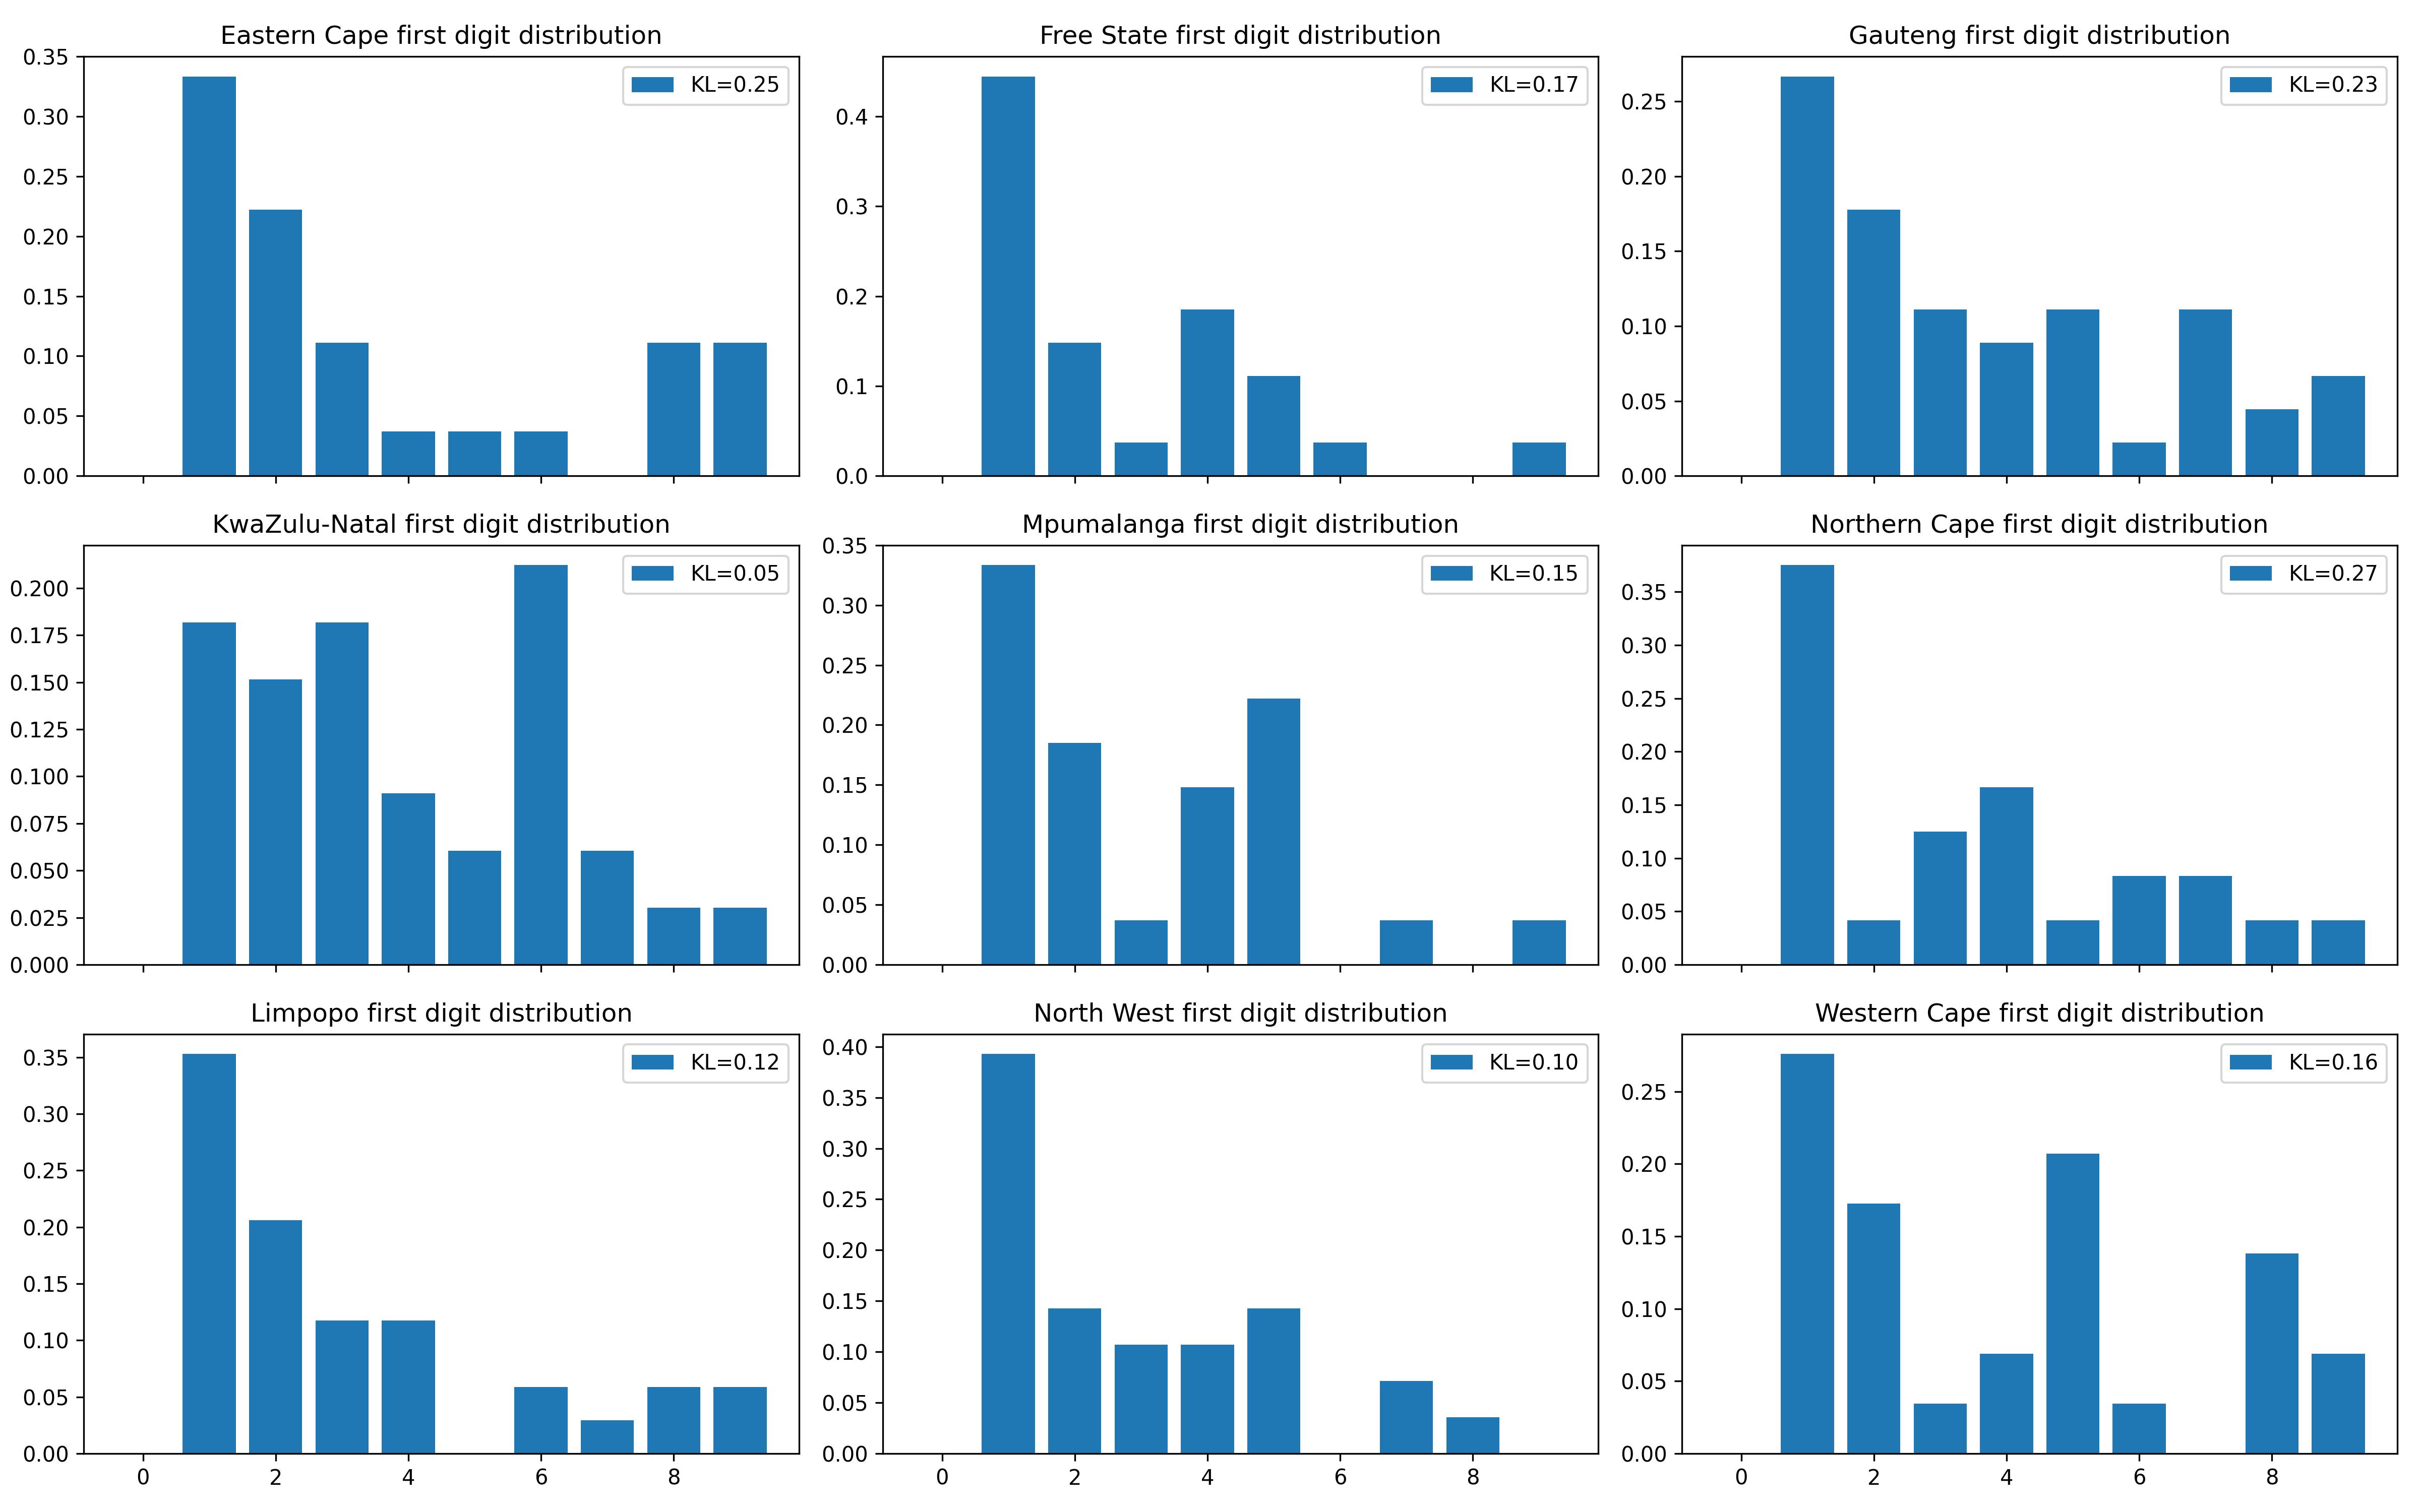
Like with national, we observe that the vote tallies for parties in all provinces resemble the Benford distribution, to a greater or lesser degree. The only province that is a little different is KZN, however it is still pretty close overall to the target distribution with a reasonably low KL divergence. KZN is where the new MK party overtook all other parties in that province, and the electoral dynamics of the location have changed pretty drastically.
All the data follows Benford’s distribution to a reasonable extent, especially considering the small sample size used here for estimating digit distributions in each province. Overall, the election numbers look pretty clean.
3. Conclusion
This post provides a time series dataset of the vote counts as they were reported in the days following the South Africa 2024 general election. In addition, some preliminary plots show that the relative performance of each party early in counting was strongly (if not entirely) indicative of their performance at the end of counting. There were no suspicious jumps in a party’s vote share after the first few percent were counted, and the data looks largely free from suspicious activity. Similarly, the national vote tallies for each party follow Benford’s law fairly strongly and the provincial counts also appear to follow the distribution well.
The two exceptions to the otherwise clean data. The first is that IEC website went dark for a few hours on the first day of counting, however I did not observe any vote jumps or strange things after the website came back online. Second, the KZN vote tallies appear to differ more from the Benford distribution than other provinces. Also, one party’s vote share there (the M.K. party) increased substantially from their early results reported when only 5% of the votes were counted. While slightly suspect and perhaps deserving a more low-level investigation into voting district-level results, overall it is not too suspicious and is explainable given the electoral dynamics and sample sizes at play for the KZN numbers.
I hope this data is useful to someone, and if you perform any additional analysis and find other interesting results, please let me know! Hopefully, at some point, the IEC will provide this time series data directly for us in the future. Until then, I hope this post has been of some use, or at least a bit interesting.
Thanks for reading :)
tags: south africa - elections - statistics - social analysis